If you’ve been doom-scrolling real estate headlines lately — “rates are high,” “buyers are waiting,” “the market is uncertain” — you could be forgiven for thinking that nothing is moving anywhere. You’d be wrong. At least in west Novato.
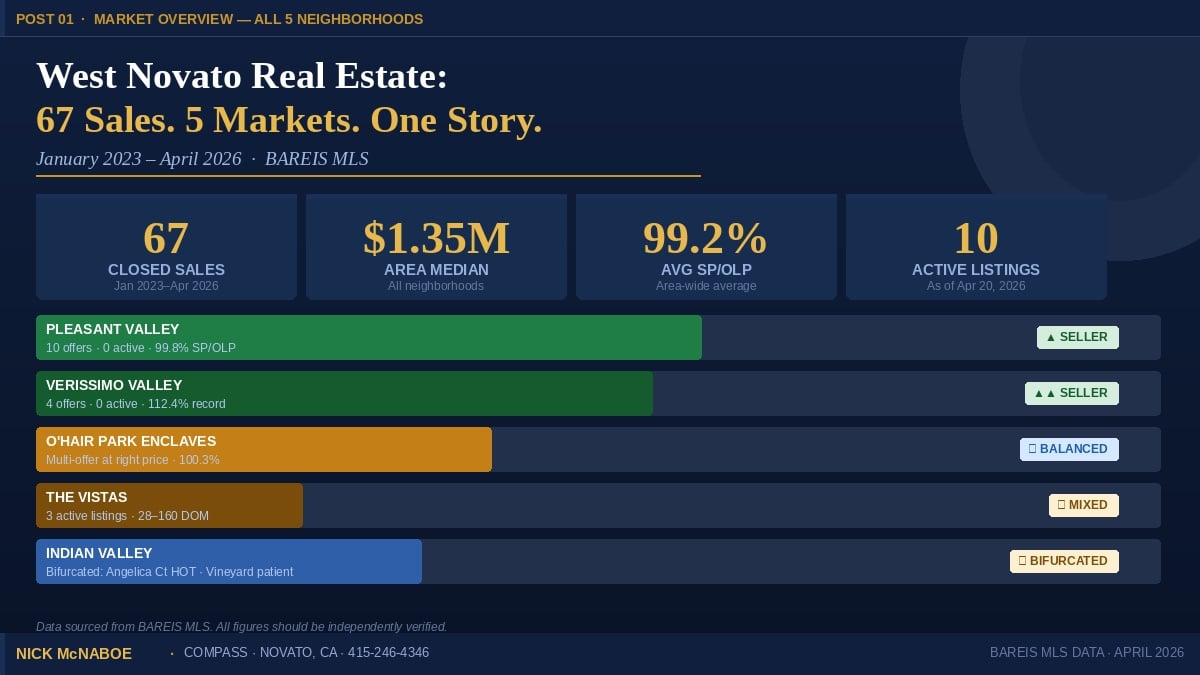
While the broader narrative talks about a market in pause mode, the data I’ve pulled from BAREIS MLS tells a more nuanced, and frankly more interesting, story. Between January 2023 and April 20, 2026, 67 residential sales closed in the Pleasant Valley area — the five neighborhoods west of Sutro Avenue and south of Novato Boulevard. And they did not all behave the same way. Not even close.
The Five Markets Inside One Zip Code
Here’s the thing about west Novato that most agents (and most buyers and sellers) miss: it isn’t one market. It’s five. Each with its own price dynamics, buyer pool, and competitive intensity. Understanding which one you’re in changes everything about your strategy.
PLEASANT VALLEY
Michele Cir · Center Rd · Sutro Ave — 28 closed sales · Median trending $1.15M · Entry tier averaging 102.8% SP/OLP
THE VISTAS
Palomino Cir · Villa Vista Ct · Pinto Ln — 7 sales · Villa Vista entry competitive, upper Palomino negotiable
O’HAIR PARK
Aries Ln · Libra Dr — Only sub-$700K attached product in area · Price-sensitive ceiling proven at $675K expired listing
VERISSIMO VALLEY
Verissimo Dr · Lorraine Ct · Los Cedros Dr — 5 closed sales · 33 Lorraine Ct: 4 offers, 1 day, 112.4% SP/OLP
INDIAN VALLEY
Angelica Ct · Oak Valley Dr · Vineyard Rd — 13 closed sales · Angelica Ct competitive, Vineyard Rd estate-pace
What Does This Mean For You Right Now?
If you’re thinking about selling: The single most important thing you can do is understand which of these five markets your home actually lives in — because the right pricing strategy for Lorraine Ct is nothing like the right strategy for Wild Horse Valley Dr, even though they’re less than two miles apart.
If you’re thinking about buying: Three active listings on The Vistas have been sitting 28–160 days. Zero active listings exist in Pleasant Valley. These two facts require completely opposite approaches. One market rewards aggression and speed. The other rewards patience and a good opener.
The Number That Should Get Your Attention
Across all 67 transactions, the average sale-price-to-original-list-price ratio is 99.2%. That’s nearly a coin flip between going over and under asking. But that average hides a dramatic spread: the hottest price segment (Pleasant Valley $825K–$975K) is averaging 102.8% SP/OLP with multiple-offer activity. The coldest segment (upper Palomino estates) is averaging closer to 89–93%.
Same zip code. Fourteen percentage points apart.
Over the coming weeks, I’ll be breaking down each of these five neighborhoods individually — the specific streets that are moving, the price tiers where buyers are winning, the data that sellers need before they price, and the intel that neither Zillow nor your neighbor’s opinion can give you. Because in this market, the difference between a great outcome and a frustrating one isn’t luck. It’s information.
